
Managing cross-platform teams: how to get real visibility — and prove a process change actually worked

Managing a modern engineering team means managing across a handful of platforms at once. The work is planned in Jira, written and reviewed in GitHub or GitLab, sometimes shipped through Azure DevOps, and tracked for the business in yet another tool. Here is the uncomfortable truth we see on nearly every CTO-as-a-Service engagement: the data a manager needs already exists. It is all there, in the tools. The problem is never that the numbers don’t exist — it’s that reading them means hopping from platform to platform and stitching the picture together by hand.
The data is already there — gathering it is the problem
Want to understand the rhythm of a team? The signals are sitting in GitHub right now: how many pull requests are open, how long they wait for review, how quickly they merge, how commits cluster through the week. Want to know where delivery is stuck? Jira knows. Want to see whether reviews are a bottleneck? That’s in the code platform too. None of this is hidden — but to actually see it, a manager has to open GitHub for the PR and commit picture, switch to Jira for delivery, cross-reference by hand, and repeat that every week. Most managers simply don’t have the hours, so the insight never gets pulled together and decisions get made on gut feel instead.

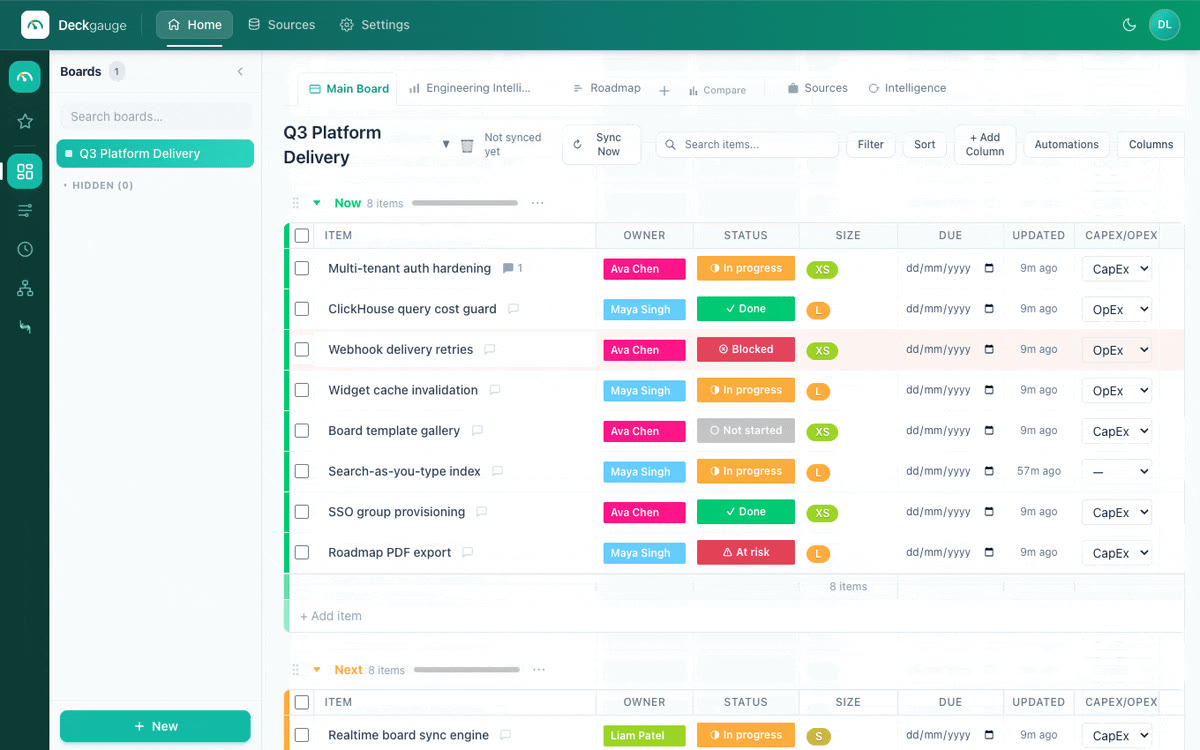
This is exactly the gap we built Deckgauge to close. It pulls commits, pull requests, reviews and issues from every platform into one view, so the rhythm of a team is something you glance at rather than something you assemble. Apache DevLake tackles the same raw data but stops at a database you have to model yourself; we wrote about that difference in DevLake gives you a database, we give you the product. The point of a single pane isn’t vanity metrics — it’s that the gathering step disappears, and the insight is finally cheap enough to look at every week.
What you cannot monitor, you cannot manage
Every manager eventually wants to change how the team works — add a WIP limit, split a service, move code review earlier, cap PR size. The hard question is the one that comes next: how do you know the change actually helped? Without a baseline you’re guessing, and “it feels faster” is not something you can take to your leadership. What you cannot monitor, you cannot manage — and what you cannot measure before and after, you cannot prove.

When the insights already live in one place, this stops being guesswork. You capture the exact picture before the change — cycle time, review latency, throughput, change-failure rate — introduce the new practice, and then look at the same picture after. If lead time dropped and quality held, you have proof, not a feeling. If nothing moved, you learn that early and try something else. That before-and-after evidence is the difference between managing a team and merely reacting to it. Just be careful the metrics stay honest rather than becoming targets to be gamed — the trap we cover in DORA metrics without gaming them — and that measuring the team never tips into surveilling individuals, which we take seriously in measuring engineers without surveillance.
Compare teams — and compare ways of working
The same visibility lets you do something most managers can only argue about in the abstract: compare teams that work differently. If one group runs a tight Scrum cadence and another is still effectively waterfall, you no longer have to debate which is “better” on principle. Put their flow, throughput and quality side by side and let the delivery data settle it — for your codebase, your product, your people. Sometimes Scrum wins; sometimes a smaller team ships more cleanly with less ceremony. What matters is that you can finally see it, and give each team the insight every manager actually needs to coach toward a better result.
Because Deckgauge is open-source and self-hostable, all of this runs on your own infrastructure with your own data — a real open-source alternative to Jellyfish and LinearB, with no per-seat ceiling on who gets to see the picture.
Visibility is the start — judgment is the rest
A dashboard tells you what is happening. Knowing which change to make, how to read a noisy trend, and how to coach a manager through it takes experience — and that’s the part software can’t hand you. This is where CodPal comes in. Our CTOs don’t just hand you a tool and walk away; they join your teams, bring the pattern-recognition of having done this many times before, and mentor your engineering managers directly — helping them read the signals, choose the right experiments, and turn visibility into better outcomes. You can see the kind of results that partnership produces in our work.
If you want the visibility, start with Deckgauge — it’s free at deckgauge.com and the source is on GitHub. If you want the visibility and a seasoned CTO helping your managers act on it, book a health check or talk to us about CTO-as-a-Service. Either way, you stop managing in the dark.